During the German Championships in order to better determine a body position during freefall, the scientists and friends from Magdeburg/Stendal University of Applied Sciences H2, led by Prof. Olaf Ueberschär, carried out measurements and published an article about their findings in ScienceDirect. Attached their article in full length!
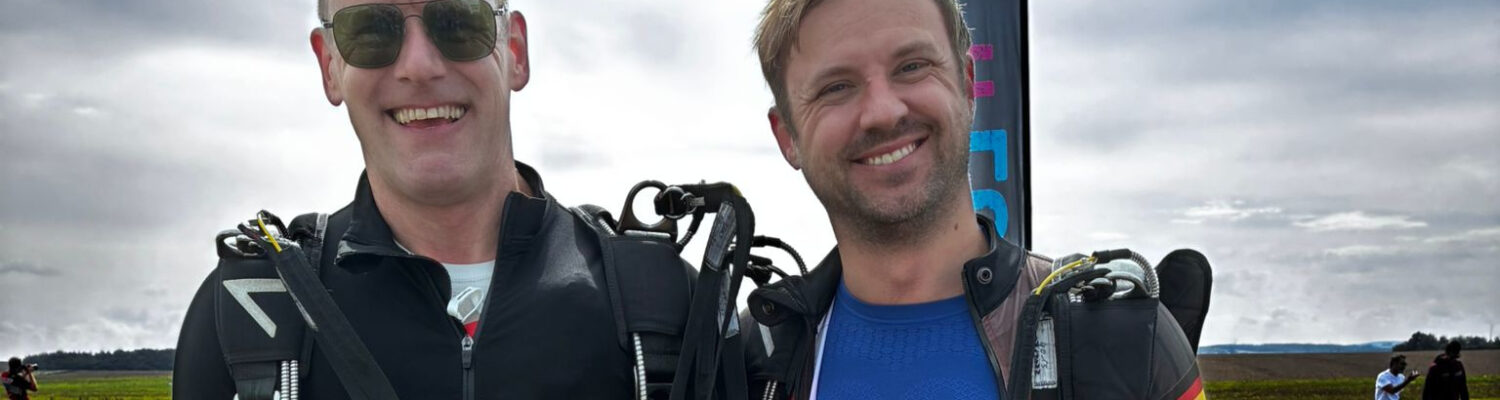
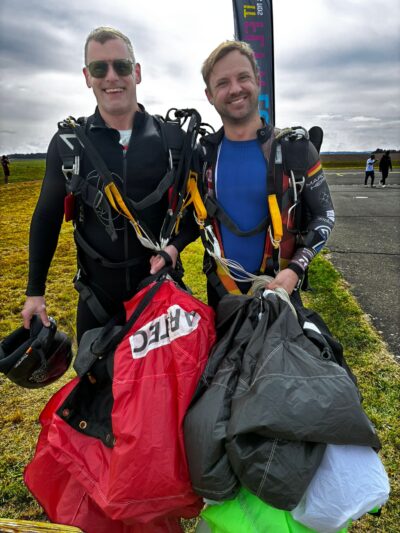
Thorsten Morhaus and Marco Hepp at the German Nationals 2026 – Photo credits: Gundel Klement
Measuring deceleration shock in elite speed skydivers using wearable inertial sensors – A pilot study
Summary
Background
In speed skydiving, athletes aim to achieve the highest possible terminal speed during free fall after exiting from an aircraft. Despite being the fastest non-motorised sport exceeding 500 km/h, scientific evidence on its biomechanical, orthopaedic, and physiological demands remains scarce. In particular, little is known about the magnitude of deceleration shock experienced by speed skydivers, although it is known to represent a major contributor to injury risk. The aim of this pilot study was to quantify deceleration shocks in elite speed skydivers during regular training, focusing on (1) the transition from accelerated free fall to flat-pose deceleration, (2) parachute deployment, and (3) landing.
Materials and methods
Three male elite speed skydivers from the German national team completed two training jumps each. They were instrumented with 6 triaxial inertial measurement units placed on their heads, lower arms, pelvis, and lower legs. Jumps were performed from an exit altitude of 4,010 m above ground level (AGL). After ∼2,300 m of free fall, the athletes transitioned to flat-pose deceleration at ∼1,700 m AGL, deployed their parachutes at ∼1,000 m AGL, and landed at 0 m AGL (∼590 m above mean sea level).
Results
Athletes reached a mean maximal terminal speed of 481.1 ± 13.3 km/h. Mean deceleration shock during flat-pose deceleration, parachute deployment, and landing ranged from 5.7 to 19.0 g across body segments, with the highest values observed in the lower legs during landing (p < 0.016). Remarkably, peak head (6.9 ± 1.2 g) and pelvic deceleration shocks (6.2 ± 0.6 g) during flat-pose deceleration were comparable to those during parachute deployment (8.0 ± 2.0 g and 5.7 ± 1.6 g), with head deceleration shocks during flat-pose deceleration and parachute deployment strongly exceeding their landing value (p = 0.018, d = 1.396 and p < 0.001, d = 3.328, respectively).
Conclusion
In contrast to conventional skydiving, speed skydiving involves a head-down accelerated streamline free fall, exposing the head, trunk, and extremities to substantial deceleration shock, particularly at its transition to flat-pose deceleration prior to parachute deployment. This important finding underscores the need for further research into the biomechanical aspects and orthopaedic risks associated with speed skydiving.
Speed skydiving is a competitive aerial sport in which athletes aim to achieve the highest possible instantaneous speed during a defined 3-s portion of a free fall [7], [16]. In particular, the athletes exit from an aircraft at 13,000–14,000 ft (3962–4267 m) above ground level (AGL), adopt a highly streamlined head-down vertical body position to minimise aerodynamic drag, and accelerate through gravity until the end of the performance window. The performance window is 7400 ft. (2256 m) long, as determined by the vertical distance between the minimum exit altitude and the mandatory break-off altitude of 5600 ft (1707 m) AGL [7]. Promoted through its formalisation by the Fédération Aéronautique Internationale (FAI), speed skydiving has been part of national and international parachuting competitions since 1999, and gained popularity [1], [16]. As of 01 January 2026, speed skydiving has also been recognised, among other parachuting disciplines, by the German Olympic Sports Confederation, admitting the German Parachuting Federation as an official member. Over the past two to three decades, speed skydiving has evolved into a technically and physiologically demanding sport that combines principles of aerodynamics, human biomechanics, and extreme-environment exposure.
All forms of skydiving are generally considered high-risk sports. A recent review revealed that the most common injuries in conventional skydiving were associated with the lumbar spine and the lower extremity, with incidences amounting to approximately 0.03% to 0.17%, and 3–10 fatalities per 1 million jumps [1]. The most common moment of sustaining an injury in skydiving is the landing sequence [1]. Despite being the fastest non-motorised sport, with terminal speeds achieved by elite athletes often near or exceeding 500 km·h−1, scientific research on the biomechanical, physiological, and safety-related aspects of speed skydiving remains highly limited [1], [16]. In particular, little is known about the magnitude of deceleration shock experienced by athletes during the different airborne phases of the skydive. However, those peak accelerations pose one of the key contributors to orthopaedic stress and injury risk during the flight phase of skydiving and parachuting in general [1], [5], [10], [15], in addition to the physiological challenges of low ambient temperatures, high air friction and substantial pressure differences in skydiving.
Therefore, the aim of this pilot study was to quantify peak 3D accelerations as direct measures of deceleration shock in national elite speed skydivers during regular training jumps, focusing on (1) the transition from vertical accelerated head-down free fall to flat-pose braking deceleration prior to parachute deployment, (2) parachute deployment, and (3) landing.
Methods
The study was conducted in the airspace above Bad Saulgau, Germany, in May 2025. The airport of Bad Saulgau is situated 590 m above mean sea level (AMSL). Three trained male speed skydivers of the national elite level (36.0 ± 13.5 years, 86.0 ± 4.6 kg, 182.7 ± 3.1 cm, BMI 25.8 ± 0.5 kg m−2) took part in this study. Inclusion criteria were (1) being part of the German national team, (2) achieving a terminal 3-s speed of at least 450 km h−1, and (3) being free of injuries at the time of measurements. The athletes wore their standard speed skydiving gear including a skintight synthetic fabric suit with helmet, their parachute backpack with an integrated backup parachute, and a wearable flight monitor that recorded position, vertical and horizontal velocities through GPS, as well as barometric altitude above ground, both at a data rate of 10 Hz (Bionics Aviation FLYSIGHT, Advanta Design, Québec, QC, Canada). For the measurements, the skydivers were additionally instrumented with six 9-degree-of-freedom inertial measurement units (IMUs; Xsens DOT, Movella Technologies, Enschede, The Netherlands) tracking triaxial accelerations (±16 g), triaxial angular velocities (±2000° s−1) and Euler angles of several relevant body segments at an internal data acquisition rate of ∼ 1000 Hz and an output rate of 120 Hz. These lightweight and small data-logging IMUs (11 g, 36 × 30 × 11 mm3) have been widely evaluated in recent research in sport sciences and biomechanics [9], [14]. The body segments investigated comprised head, lower arms, pelvis and lower legs throughout the flight until landing. All IMUs were attached to the skin using medical–grade tape and covered by the skintight speed–skydiving suit to minimise movement artefacts during free fall and deceleration phases. For assessing peak deceleration shocks, the magnitude of triaxial accelerations was calculated as time series according to3D()=√(())2+(())2+(())2where (),∈{,,}, denote the acceleration components in x, y and z direction of the local frame of reference of the IMU. Similarly, the angular velocity of body segments was assessed based on the magnitude of the vector →=(,,)T obtained by triaxial gyroscopes, i.e.3D()=√(())2+(())2+(())2.The athletes were carried by an airplane to their exit altitude of 4594 m AMSL, i.e. 4010 m above ground, and exited the aircraft with a horizontal velocity of 165.2 ± 14.2 km h−1 and zero vertical velocity (Fig. 1a) and immediately adopted a head-down streamline position to minimise air drag and maximise downward acceleration during free fall (Fig. 1b). After ∼2300 m of free fall, the athletes initiated the first deceleration phase at ∼1700 m AGL by adopting a horizontally flat body pose with a maximum cross-sectional area (Fig. 1c), but the parachute still undeployed. After ∼700 m in this phase, they deployed the parachute at ∼1000 m AGL, decelerated further (Fig. 1d) and landed at 0 m AGL, i.e. ∼580 m AMSL, on the airfield (Fig. 1e). The athletes repeated this procedure once on the same day, resulting in two skydives each. Weather conditions during all measurement flights were stable, with clear visibility, low wind speeds, and no precipitation, ensuring consistent aerodynamic and environmental conditions across jumps.
Fig. 1. Schematic of key phases in speed skydiving and measurement procedure. (a) Exit from aircraft; (b) head-down accelerated free fall; (c) deceleration phase; (d) parachute deployment and further deceleration; (e) landing.
This study was conducted in accordance with the Declaration of Helsinki, and was approved by the Ethics Committee of the Department of Engineering and Industrial Design of the Magdeburg-Stendal University of Applied Sciences under approval number EKIWID-2025-12-004OUe. All subjects gave their written informed consent prior to participation and were free to withdraw from the study at any time.
Unless stated otherwise, results of statistical analysis are given as arithmetic means ± standard deviation (SD). The level of statistical significance was set at α < 0.05. Inferential statistics were conducted using a two-way repeated-measure analysis of variance (ANOVA) based on peak triaxial acceleration magnitudes measured during skydives. Prior to this, normal distribution had been confirmed by means of the Shapiro–Wilk test (p = 0.733). The two main factors comprised (i) skydive phase (i.e. flat-pose deceleration, parachute deployment, and landing), and (ii) body segment (head, arms, pelvis, and legs). For the arms and legs, the values of the left and right limb were aggregated to one value each. Effect sizes were assessed based on partial eta squared (ηp2) and rated according to Cohen: negligible for ηp2 < 0.01, small for 0.01 ≤ ηp2 < 0.06, medium for 0.06 ≤ ηp2 < 0.14, and large for ηp2 ≥ 0.14 [4]. Analogously, effect sizes in the Bonferroni-corrected post-hoc t-test comparisons were calculated and evaluated according to Cohen’s d with negligible (d < 0.2), small (0.2 ≤ d < 0.5), medium (0.5 ≤ d < 0.8) and large effects (d ≥ 0.8) [4].
Results
Five out of six skydives could be included in the analysis, whereas one bout had to be discarded due to sensor malfunction (unintentionally switched off by athlete). The athletes achieved an average maximal terminal speed of 481.1 ± 13.3 km h−1 (461.6–493.8 km h−1). Fig. 2 depicts an exemplary speed skydive recording acquired in one of the bouts of this study, showing both IMU triaxial acceleration data (thin coloured lines) and GPS velocity data (thick solid purple and dashed magenta lines).
Fig. 2. Example time series of selected IMU metrics during a skydive as measured in the study. (a) Full time series: The athlete exits the aircraft at time t ≈ 0 s (marking end of phase 1), immediately begins the head-down acceleration phase (2; light yellow background), transitions into the deceleration phase in horizontal body pose (3; light orange background) at t ≈ 25.55 s and deploys his parachute at t ≈ 37.46 s, marking the beginning of the parachuting phase (4; light grey background). At t ≈ 131.87 s he touches ground (5). The thin coloured lines show the magnitudes a3D of the triaxial accelerations measured at the legs (green colour tones), arms (blue tones), the pelvis (red, approximately corresponding to the athletes’ centre of mass) and his head (yellow). The values are given in units of standard gravity g = 9.80665 m s−2. The thick lines depict vertical downward velocity (solid purple) and horizontal velocity (dashed magenta) in km h−1 as measured through GPS. (b) Magnified region of the time series around the transition from the acceleration phase to the deceleration phase during free fall. (c) Magnified region around landing. (d) Close-up of time series range of (b) with accelerometer data of head and pelvis supplemented with the magnitude of their angular velocities ω3D as determined by triaxial gyroscopes. (e) Close-up of range of (c) with plots as in (d), i. e. a3D and ω3D.
The five distinct phases – (1) transport in aircraft, (2) exit from aircraft and initiation of head-down free fall, (3) deceleration in horizontal flat-body pose prior to parachute deployment, (4) parachute deployment and subsequent second deceleration phase, and (5) landing are clearly marked by the GPS-based downward velocity component (thick purple line). In addition, the corresponding phase transitions can easily be distinguished by means of the local extrema of the magnitude a3D of triaxial acceleration of head (red), arms (bluish colours), pelvis (orange), legs (greenish colours), which occur predominantly at the time spots of phase transitions or within +1 s thereafter (cf. Fig. 2b, c).
Based on this segmentation procedure, the average peak accelerations acting on the body segments of the athletes during the different phases and phase transitions were calculated. Notably, the highest peak accelerations of head, pelvis and legs were recorded during phase transitions and not within phases. Only for the arms, peak accelerations were sometimes higher prior to the exact moment of phase transition, most probably because the arms were used to deploy the parachute or for manual adjustments. The cohort results of peak accelerations during phase transitions are summarised in Fig. 3 as means ± SD (error bars), along with cohort maxima (up triangles). In addition, because of their relevance to a potential whiplash mechanism, the corresponding mean peak angular velocities of head and pelvis are depicted in Fig. 4.
Fig. 3. Mean peak accelerations during the different skydiving phase transitions. The bars depict the arithmetic mean of a3D in units of standard gravity g, while the error bars represent the standard deviation. Up triangles show the maximal values observed in the cohort.
Fig. 4. Mean peak angular velocities of head and pelvis during the different skydiving phase transitions. The bars depict the arithmetic mean of ω3D in units of degrees per seconds, while the error bars represent the standard deviation. Up triangles show the maximal values observed in the cohort.
The ANOVA revealed statistically significant results for both the skydive phase (p = 0.035, ηp2 = 0.705) and the body segment (p < 0.001, ηp2 = 0.905), as well as for the interaction skydive phase × body segment (p = < 0.001, ηp2 = 0.916). Subsequent post-hoc pairwise comparisons principally revealed significant differences between parachute deployment and landing (p = 0.001), and between all body parts when compared to the legs (p = 0.016). In summary, the head and pelvis of the skydivers were exposed to mean peak deceleration shocks of 6.9 ± 1.2 g / 6.2 ± 0.6 g during the initiation of free fall deceleration (phase transition 2→3), 8.0 ± 2.0 g / 5.7 ± 1.6 g at parachute deployment (3→4), and 4.8 ± 1.3 g / 9.7 ± 3.2 g during landing, respectively. Across body segments, there were no significant differences in deceleration shocks during flat-pose deceleration and parachute deployment (p = 0.200). In particular, peak head and pelvic deceleration shocks during flat-pose deceleration did not significantly differ from those during parachute deployment (p = 0.234 and p = 0.630, respectively), with head deceleration shock during flat pose deceleration and parachute deployment strongly exceeding its landing value (p = 0.018, d = 1.396 and p < 0.001, d = 3.328, respectively). Noteworthily, the significant difference between flat-pose deceleration and landing across body segments was primarily due to the highest peak accelerations acting on the legs during landing.
Discussion
The aim of this pilot study was to quantify deceleration shocks in elite speed skydiving during the transition from head-down free fall to flat-pose deceleration, at parachute deployment, and during landing. For conventional parachuting, previous research reported typical values of parachute opening shock to the head and trunk of 5.8 ± 1.6 g and 4.3 ± 1.5 g[1], [15]. The corresponding deceleration shocks of 8.0 ± 2.0 g and 5.7 ± 1.6 g found in this study are slightly higher, but still appear comparable given the reported standard deviations. Moreover, it seems conceivable that the parachute opening shock in elite speed skydivers, as measured in this study, is generally higher than that of conventional parachutists, given that the speed of athletes is generally higher in speed skydiving. Overall, high accelerations acting on the head during parachute deployment, leading to rapid head and neck movements, may pose risks for traumatic neck injuries, impaired cognitive function or the onset of traumatic injuries to the central nerval system [3], [11], [17]. For instance, previous research has documented neurological complications such as syringomyelia following repeated high–force parachute openings [18]. This aspect becomes even more important when considering the potential risk of an unintentional parachute deployment during the head-down free fall phase, before the deceleration phase is initiated. The deceleration shocks at that stage would highly exceed the values found in this study, and would probably also exceed the thresholds of acute injury.
In general, the magnitudes of tolerable peak accelerations differ substantially depending on body axis, direction, and duration of exposure [13]. For instance, visual impairment and g-force induced loss of consciousness (G-LOC) are likely to occur already at around +3.8 to +5.2 g in the head-to-foot direction if exposed to for more than 5–10 s [13]. Notwithstanding, interindividual variability is high, with the most susceptible individuals reported to have experienced visual symptoms already at ∼2.5 g[13]. In the foot-to-head direction, in turn, critical thresholds are reached at only –2 to –3 g[13]. Transverse loading is tolerated up to markedly higher short-duration peaks of 12–15 g, and lateral loading primarily challenges cervical musculoskeletal structures rather than cardiovascular tolerance [13].
A comparison of those established tolerance limits to the peak accelerations and durations recorded in this study allows a deeper quantitative analysis: As to overall body acceleration, the pelvis sensor is situated close to the centre of mass of the skydiver, indicating that pelvic acceleration provides a good estimate of overall body kinematics. As such, the skydivers were subject to peak body accelerations of +6.2 ± 0.6 g (maximum: +7.0 g) in an (initial) head-to-foot direction at transition 2→3 (flat-phase deceleration), and of –5.7 ± 1.6 g (–8.5 g) in approximate foot-to-head direction during transition 3→4 (parachute opening). While those amplitudes clearly exceeded the corresponding critical thresholds of +2.5 to +5.2 g and –2 to –3 g generally considered uncritical, the duration of exposure was typically of the order of 1.0 s at transition 2 → 3 and 0.1 s at 3 → 4 (cf. Fig. 2d, e), clearly falling short of relevant critical exposure times.
Regarding head kinematics, the relative motion between the head and the trunk is certainly of particular interest to injury mechanisms, both in a translational and rotational sense. Although the IMUs used in this study were equipped with both triaxial gyroscopes and magnetometers to obtain a reliable and stable estimate of relative orientation in space, the relative orientation particularly of the head sensor was heavily distorted due to the magnetic visor locks built into the skydiving helmets. Wind tunnel tests prior to this study had confirmed that magnetic distortions were too strong to allow a valid derivation of body segment orientations during flight. Therefore, it was not possible to evaluate the relative motion of the head with respect to the trunk in terms of relative linear accelerations or relative angular velocities. Irrespective of this technical issue, the mean differences of head vs. pelvis acceleration magnitudes was low, amounting to only 1.0 ± 0.6 g. Assuming that trained, experienced skydivers are able to control their body movements during phase transitions to a reasonable extent, it seems likely that the orientation-sensitive vector difference in head and trunk accelerations was of the same order of magnitude, and can thus be considered uncritical as well.
Moreover, when considering the potential risk of a whiplash motion of the head, peak absolute angular velocities of the head during flat-pose deceleration, parachute deployment and landing observed in the study cohort were on average 430.4 ± 212.2°/s (range 309.8–934.5°/s), falling below the threshold of an elevated risk of whiplash injury, typically attributed to angular velocities above ∼1000–1700 °/s [2], [6]. Nonetheless, as the IMUs were unable to provide reliable spatial orientation data, the actual relative angular velocity between the head and the trunk might have been greater, notably if the trunk rotational movement was – in the worst case – substantially rotating in the opposite direction to the head. This scenario, however, is again rather improbable given a controlled skydive conducted by an experienced, conscious athlete.
From a more general perspective, the results of our study demonstrate that the average deceleration shocks and potential whiplash motions acting on the head (and the trunk) during the initiation of the flat-pose deceleration phase are roughly as high as during parachute deployment. This finding provides an important new insight, given that the sparse previous research in skydiving [11] – and parachuting in general [1], [10], [15] – has solely focused on the parachute opening. During landing, our data indicate that the athletes’ heads were subject to lower shocks than during the flight phases, whereas the pelvis and, particularly, the legs were exposed to the highest peak accelerations measured during the skydive. Altogether, such a high musculoskeletal loading of the lower extremity and the pelvis/ lumbar region during landing was expected in view of the biomechanical characteristics of that process [1], [8]. Moreover, it is in line with epidemiologic data reported for skydivers, with the most common injury sites being the lumbar spine and the lower extremity, sustained during landing [1]. The high airborne deceleration stress particularly on the head, in turn, may be an outcome less intuitive to non-expert orthopaedists and biomechanists, although neck pain has been known to be associated with parachute opening shock before, and belongs to the most prevalent musculoskeletal complaints in active skydivers [10], [11], [12].
Lastly, there are several limitations that must be noted for this pilot study: First, the small number of participants, owing to their high level of expertise, and the fact that only two jumps per athlete were considered, limits statistical power. Second, the measurement range of +16 g of the utilised IMUs may not have sufficed in detecting actual peak accelerations of the lower legs during landing. In the future, IMUs with a higher measurement range should be employed.
Conclusions
Different from conventional skydiving, speed skydiving is characterised by a head-down accelerated vertical free-fall phase, which exposes, when terminated, the athlete’s heads, trunks and extremities to comparable or even higher deceleration shock than during the deployment of the parachute. Remarkably, the athlete’s head is subject to highest peak accelerations during flight, not during landing. While all observed peak deceleration shock magnitudes and durations, as well as potential whiplash motions, remained below the generally accepted critical thresholds of severe danger of injury or unconsciousness, future research is clearly indicated to further elucidate the biomechanical and orthopaedic stress to the human body experienced during speed skydiving. In addition, sport orthopaedics and coaches may utilise these new insights into the physiological and biomechanical requirements of speed skydiving to optimise exercise and conditioning routines, and improve talent identification.
You are currently viewing a placeholder content from Facebook. To access the actual content, click the button below. Please note that doing so will share data with third-party providers.
You are currently viewing a placeholder content from Instagram. To access the actual content, click the button below. Please note that doing so will share data with third-party providers.
You are currently viewing a placeholder content from Newsletter2Go. To access the actual content, click the button below. Please note that doing so will share data with third-party providers.
You are currently viewing a placeholder content from X. To access the actual content, click the button below. Please note that doing so will share data with third-party providers.